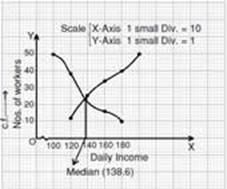
Q. 30. The following table gives the daily income of 50 workers of a factory. Draw both types (“less than type” and “greater than type”) ogives and determine the median of the data .
| Daily income (in Rs.) | Number ofworkers |
| 100-120 | 12 |
| 120-140 | 14 |
| 140-160 | 8 |
| 160-180 | 6 |
| 180-200 | 10 |
Sol.
| D. income less than | Nos. of workers (c.f) | D.income more than | Nos. of workers (c.f.) |
| 120 | 12 | 100 | 50 |
| 140 | 26 | 120 | 38 |
| 160 | 34 | 140 | 24 |
| 180 | 40 | 160 | 16 |
| 200 | 50 | 180 | 10 |
| Mathematics 2008 Question Papers Class X | |||||||
| Delhi | Outside Delhi | Compartment Delhi | Compartment Outside Delhi | ||||
| All Sets(PDF) | Set 1 | Set 1 | |||||
| Set 2 | Set 2 | ||||||
| Set 3 | Set 3 | ||||||