Statistics is the science which studies the methods and techniques used in the collection, presentation and analysis of data and draws. conclusion on the basis of the same. The statistics is thus, used in two senses:
In this portion we shall learn the pictorial representation of data such as Pie charts, the mean of grouped data and primary idea of probability.
Pictorial Representation of data:
Some times different. Charts are drawn to interprete any data. They are:
(i) Histogram
(ii) Frequency polygon
(iii) Frequency curve
(iv) Bar diagram
(v) Line graph
(vi) Pictograph and
(vii) Pie charts
We shall study on the pie charts in this section and illustrate with example:
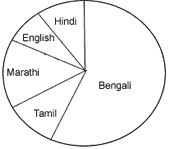
Example 1. The number of students in a hostel speaking different languages are given below. Represent the data as a pie chart.
| Language | Bengali | Hindi | English | Marathi | Tamil |
| Number of students | 40 | 12 | 4 | 9 | 7 |
Solution:- The following table gives the share of each language as component of 3600.
| Language | Number of students | Share as a component of 3600 |
| Bengali | 40 | 40 X 3600/72 = 2000 |
| Hindi | 12 | 12 X 3600/72 = 600 |
| English | 4 | 4 X 3600/72 = 200 |
| Marathi | 9 | 9 X 3600/72 = 450 |
| Tamil | 7 | 7 X 3600/72 = 350 |
| Total | 72 | 3600 |

Now we shall draw a circle of any convenient radius. First of all we shall fixed a sector of central angle 2000 depending on the share of Bengali language. Similarly, sectors of other languages are marked.
| Subjects | Maths (Part-1) by Mr. M. P. Keshari |
| Chapter 9 | Circle |
| Chapter 10 | Tangents to a circle |
| Chapter 11 | Geometrical Construction |
| Chapter 12 | Troigonometry |
| Chapter 13 | Height and Distance |
| Chapter 14 | Mensuration |
| Chapter 15 | Statistics |
| Chapter 16 | Probability |
| Chapter 17 | Co-ordinate Geometry |